
Brooklyn, NY
Established 1948
Established 1948
Comparison of Radiation Exposures
There are four related ways of measuring radiation which can be remembered as R-E-A-D. Both British and SI units are in use. From the Nuclear Regulatory Commission web site1.
- Radioactivity refers to the amount of ionizing radiation released by a material. Whether it emits alpha or beta particles, gamma rays, x-rays, or neutrons, a quantity of radioactive material is expressed in terms of its radioactivity (or simply its activity), which represents how many atoms in the material decay in a given time period. The units of measure for radioactivity are the curie (Ci) and becquerel (Bq).
- Exposure describes the amount of radiation traveling through the air. Many radiation monitors measure exposure. The units for exposure are the roentgen (R) and coulomb/kilogram (C/kg).
- Absorbed dose describes the amount of radiation absorbed by an object or person (that is, the amount of energy that radioactive sources deposit in materials through which they pass). The units for absorbed dose are the radiation absorbed dose (rad) and gray (Gy).
- Dose equivalent (or effective dose) combines the amount of radiation absorbed and the medical effects of that type of radiation. For beta and gamma radiation, the dose equivalent is the same as the absorbed dose. By contrast, the dose equivalent is larger than the absorbed dose for alpha and neutron radiation, because these types of radiation are more damaging to the human body. Units for dose equivalent are the roentgen equivalent man (rem) and sievert (Sv), and biological dose equivalents are commonly measured in 1/1000th of a rem (known as a millirem or mrem).
The sievert is the unit we will typically use and, in colloquial use, is often referred to as exposure even though this is technically dose equivalent. For most purposes, 1 R (roentgen, exposure) = 1 rad (absorbed dose) = 1 Sv (dose equivalent).
Comparison of Exposures
The table below comes from the UK public health web site2. The assumption in radiation exposure risk is referred to a "linear no-threshold" abbreviated as LNT. That is, the assumption of risk is that doubling the threshold doubles the health risk. The actual health risks at the lowest exposures are the least understood because there are many background sources that are not easily tracked making the data very noisy. Additionally, there are some indications that low radiation doses may actually be beneficial, something known as "radiation hormesis."3456
| Source of exposure | Dose |
|---|---|
| Dental x-ray | 0.005 mSv |
| 100g of Brazil nuts | 0.01 mSv |
| Chest x-ray | 0.014 mSv |
| Transatlantic flight | 0.08 mSv |
| Nuclear power station worker average annual occupational exposure (2010) | 0.18 mSv |
| UK annual average radon dose | 1.3 mSv |
| CT scan of the head | 1.4 mSv |
| UK average annual radiation dose | 2.7 mSv |
| USA average annual radiation dose | 6.2 mSv |
| CT scan of the chest | 6.6 mSv |
| Average annual radon dose to people in Cornwall | 6.9 mSv |
| CT scan of the whole spine | 10 mSv |
| Annual exposure limit for nuclear industry employees | 20 mSv |
| Level at which changes in blood cells can be readily observed | 100 mSv |
| Acute radiation effects including nausea and a reduction in white blood cell count | 1000 mSv |
| Dose of radiation which would kill about half of those receiving it in a month | 5000 mSv |
The highest levels on the chart are well documented, mostly from accidental exposures. A prompt/acute does of 1 Sv is sufficient to make you very sick, and increase your cancer risk. 5-10 Sv will likely leave you dead in a few days to a month. Over 100 Sv will lead to death in a few hours.7
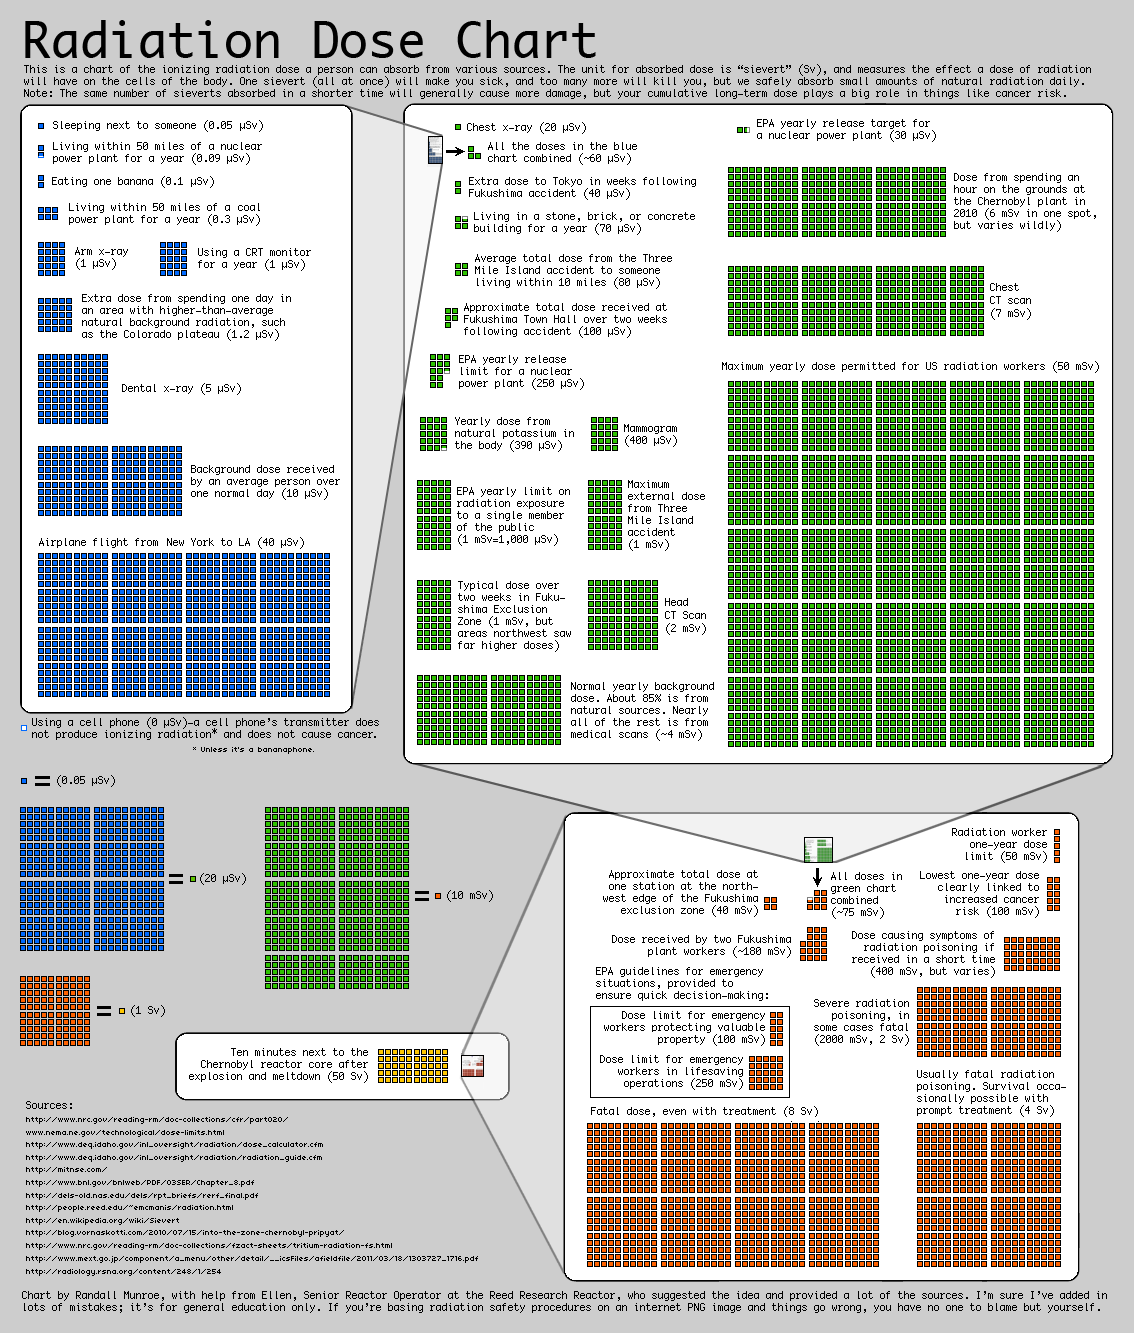
Graphical Comparison of Exposures
The image below is from xkcd.com and provides a good graphical display of exposures from various activities
- 1. https://www.nrc.gov/about-nrc/radiation/health-effects/measuring-radiati...
- 2. https://www.gov.uk/government/publications/ionising-radiation-dose-compa...
- 3. https://en.wikipedia.org/wiki/Radiation_hormesis
- 4. http://blogs.discovermagazine.com/crux/2015/04/06/small-radiation/#.Wgn6...
- 5. https://www.ncbi.nlm.nih.gov/pmc/articles/PMC2477686/
- 6. http://www.nytimes.com/2011/04/05/health/05radiation.html
- 7. http://www.radiationanswers.org/radiation-and-me/effects-of-radiation.html
- Log in to post comments